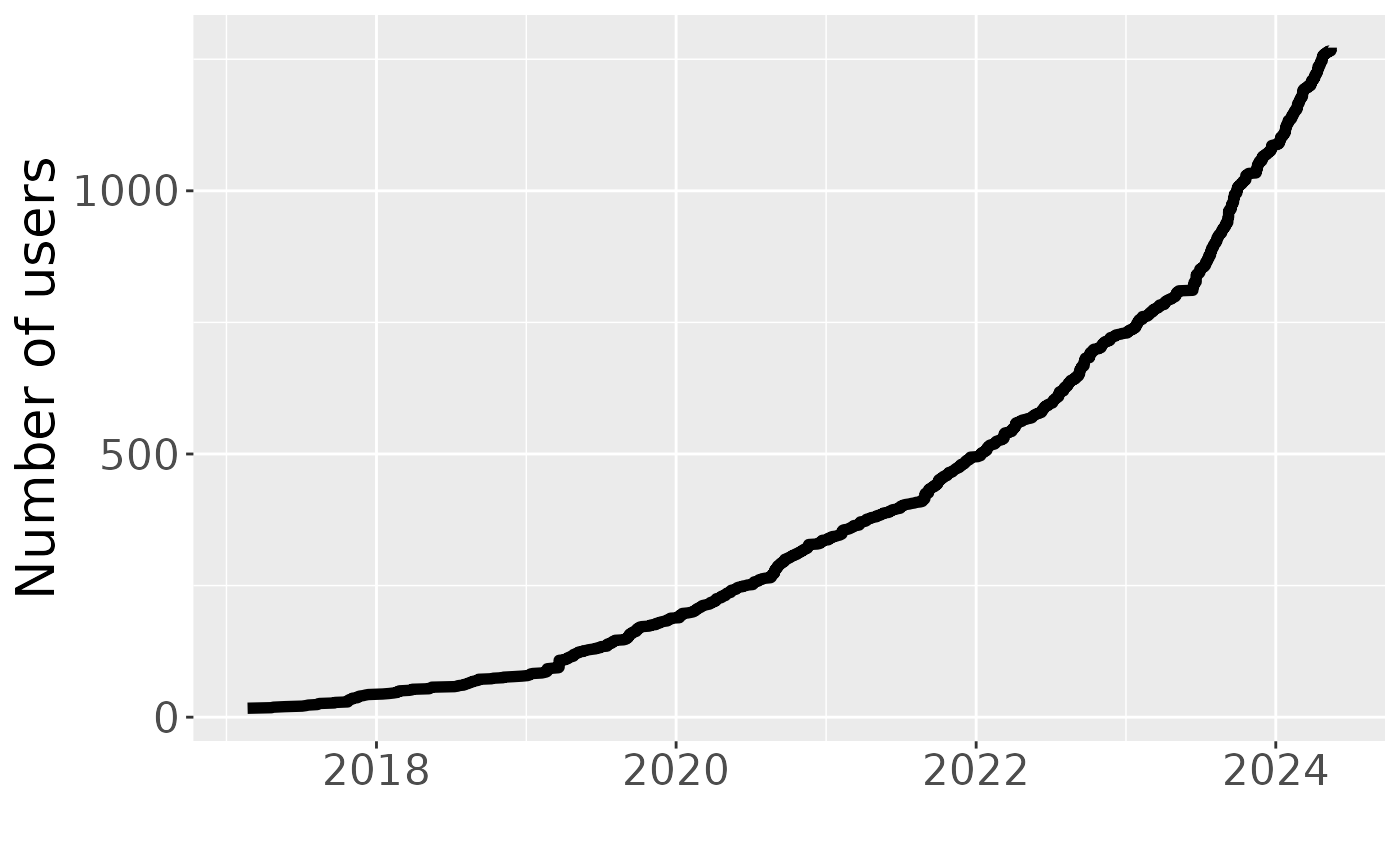
The number of Wynton users over time
users_over_time(file = NULL, since = "2017-01-01")Arguments
Value
A tibble::tibble with columns date and total,
total the cumulative sum based on date occurances.
Examples
library(dplyr)
#>
#> Attaching package: ‘dplyr’
#> The following objects are masked from ‘package:stats’:
#>
#>     filter, lag
#> The following objects are masked from ‘package:base’:
#>
#>     intersect, setdiff, setequal, union

pathname <- system.file("exdata", "ldap_wynton_dates.txt", package = "wyntonquery")

signups <- users_over_time(pathname)
print(head(signups))
#> # A tibble: 6 × 2
#>   date       total
#>   <date>     <int>
#> 1 2017-02-21     8
#> 2 2017-04-25     9
#> 3 2017-05-23    10
#> 4 2017-07-04    11
#> 5 2017-08-10    12
#> 6 2017-10-23    13
print(tail(signups))
#> # A tibble: 6 × 2
#>   date       total
#>   <date>     <int>
#> 1 2026-07-20   977
#> 2 2026-07-22   978
#> 3 2026-07-25   979
#> 4 2026-07-28   980
#> 5 2026-07-29   981
#> 6 2026-07-30   982

## Summarize by year and month
signups <- mutate(signups, year = format(date, "%Y"))

## Signups per calendar year
signups <- mutate(signups, month = format(date, "%m"))
signups <- group_by(signups, year)
signups_per_year <- count(signups, name = "change")
signups_end_of_year <- filter(signups, date == max(date), total == max(total))
signups_per_year <- left_join(signups_per_year, signups_end_of_year)
#> Joining with `by = join_by(year)`
signups_per_year <- select(signups_per_year, year, change, total, per = date)
print(signups_per_year, n = Inf)
#> # A tibble: 10 × 4
#> # Groups:   year [10]
#>    year  change total per
#>    <chr>  <int> <int> <date>
#>  1 2017      12    19 2017-12-12
#>  2 2018      13    32 2018-11-30
#>  3 2019      57    89 2019-12-11
#>  4 2020      62   151 2020-12-16
#>  5 2021      77   228 2021-12-18
#>  6 2022      95   323 2022-12-06
#>  7 2023     103   426 2023-12-22
#>  8 2024     179   605 2024-12-28
#>  9 2025     229   834 2025-12-23
#> 10 2026     148   982 2026-07-30

## Signups per calendar month
signups <- group_by(signups, year, month)
signups_per_month <- count(signups, name = "change")
signups_end_of_month <- filter(signups, date == max(date), total == max(total))
signups_per_month <- left_join(signups_per_month, signups_end_of_month)
#> Joining with `by = join_by(year, month)`
signups_per_month <- select(signups_per_month, year, month, change, total, per = date)
print(signups_per_month, n = Inf)
#> # A tibble: 106 × 5
#> # Groups:   year, month [106]
#>     year  month change total per
#>     <chr> <chr>  <int> <int> <date>
#>   1 2017  02         1     8 2017-02-21
#>   2 2017  04         1     9 2017-04-25
#>   3 2017  05         1    10 2017-05-23
#>   4 2017  07         1    11 2017-07-04
#>   5 2017  08         1    12 2017-08-10
#>   6 2017  10         1    13 2017-10-23
#>   7 2017  11         4    17 2017-11-21
#>   8 2017  12         2    19 2017-12-12
#>   9 2018  01         1    20 2018-01-26
#>  10 2018  02         2    22 2018-02-26
#>  11 2018  03         1    23 2018-03-22
#>  12 2018  05         2    25 2018-05-14
#>  13 2018  07         1    26 2018-07-18
#>  14 2018  08         2    28 2018-08-24
#>  15 2018  09         3    31 2018-09-07
#>  16 2018  11         1    32 2018-11-30
#>  17 2019  02         8    40 2019-02-21
#>  18 2019  03        15    55 2019-03-22
#>  19 2019  04         9    64 2019-04-30
#>  20 2019  05         6    70 2019-05-28
#>  21 2019  06         4    74 2019-06-30
#>  22 2019  07         1    75 2019-07-29
#>  23 2019  08         3    78 2019-08-26
#>  24 2019  09         2    80 2019-09-19
#>  25 2019  10         3    83 2019-10-31
#>  26 2019  11         5    88 2019-11-26
#>  27 2019  12         1    89 2019-12-11
#>  28 2020  01         6    95 2020-01-29
#>  29 2020  02         4    99 2020-02-29
#>  30 2020  03         5   104 2020-03-25
#>  31 2020  04         4   108 2020-04-20
#>  32 2020  05         6   114 2020-05-20
#>  33 2020  06         1   115 2020-06-02
#>  34 2020  07         7   122 2020-07-21
#>  35 2020  08        10   132 2020-08-31
#>  36 2020  09         5   137 2020-09-21
#>  37 2020  10         5   142 2020-10-30
#>  38 2020  11         7   149 2020-11-19
#>  39 2020  12         2   151 2020-12-16
#>  40 2021  01         4   155 2021-01-25
#>  41 2021  02         6   161 2021-02-26
#>  42 2021  03         4   165 2021-03-23
#>  43 2021  04         4   169 2021-04-27
#>  44 2021  05         5   174 2021-05-21
#>  45 2021  06         7   181 2021-06-30
#>  46 2021  07         4   185 2021-07-27
#>  47 2021  08         9   194 2021-08-30
#>  48 2021  09        11   205 2021-09-30
#>  49 2021  10        11   216 2021-10-27
#>  50 2021  11         5   221 2021-11-25
#>  51 2021  12         7   228 2021-12-18
#>  52 2022  01         8   236 2022-01-30
#>  53 2022  02         8   244 2022-02-26
#>  54 2022  03         9   253 2022-03-31
#>  55 2022  04         4   257 2022-04-27
#>  56 2022  05         7   264 2022-05-27
#>  57 2022  06         4   268 2022-06-29
#>  58 2022  07         7   275 2022-07-27
#>  59 2022  08         5   280 2022-08-31
#>  60 2022  09        23   303 2022-09-24
#>  61 2022  10        11   314 2022-10-25
#>  62 2022  11         8   322 2022-11-23
#>  63 2022  12         1   323 2022-12-06
#>  64 2023  01         7   330 2023-01-31
#>  65 2023  02         4   334 2023-02-24
#>  66 2023  03         6   340 2023-03-13
#>  67 2023  04         5   345 2023-04-26
#>  68 2023  05         6   351 2023-05-10
#>  69 2023  06        10   361 2023-06-30
#>  70 2023  07         6   367 2023-07-29
#>  71 2023  08        11   378 2023-08-29
#>  72 2023  09        27   405 2023-09-30
#>  73 2023  10        10   415 2023-10-24
#>  74 2023  11         9   424 2023-11-29
#>  75 2023  12         2   426 2023-12-22
#>  76 2024  01        16   442 2024-01-31
#>  77 2024  02        14   456 2024-02-29
#>  78 2024  03         6   462 2024-03-27
#>  79 2024  04        16   478 2024-04-24
#>  80 2024  05        11   489 2024-05-29
#>  81 2024  06        15   504 2024-06-28
#>  82 2024  07        13   517 2024-07-27
#>  83 2024  08        14   531 2024-08-31
#>  84 2024  09        36   567 2024-09-27
#>  85 2024  10        16   583 2024-10-31
#>  86 2024  11         4   587 2024-11-22
#>  87 2024  12        18   605 2024-12-28
#>  88 2025  01        15   620 2025-01-31
#>  89 2025  02        15   635 2025-02-28
#>  90 2025  03         6   641 2025-03-21
#>  91 2025  04         6   647 2025-04-29
#>  92 2025  05        12   659 2025-05-28
#>  93 2025  06        11   670 2025-06-21
#>  94 2025  07        26   696 2025-07-30
#>  95 2025  08        27   723 2025-08-29
#>  96 2025  09        38   761 2025-09-30
#>  97 2025  10        40   801 2025-10-30
#>  98 2025  11        21   822 2025-11-27
#>  99 2025  12        12   834 2025-12-23
#> 100 2026  01        29   863 2026-01-29
#> 101 2026  02        31   894 2026-02-24
#> 102 2026  03        20   914 2026-03-24
#> 103 2026  04        18   932 2026-04-23
#> 104 2026  05         7   939 2026-05-30
#> 105 2026  06        19   958 2026-06-26
#> 106 2026  07        24   982 2026-07-30


if (require("ggplot2", quietly = TRUE)) {
  gg <- ggplot(signups, aes(date, total)) + geom_line(linewidth = 2.0)
  gg <- gg + xlab("") + ylab("Number of users")
  gg <- gg + theme(text = element_text(size = 20))
  print(gg)
}